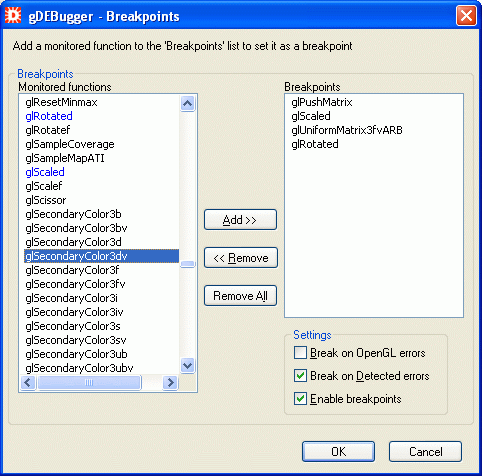
The Breakpoint dialog lets you choose OpenGL, WGL and OpenGL extension functions breakpoints.
The debugged process execution is suspended when a debugged process thread calls a function marked as a breakpoint. The process run is suspended before the function is executed, letting you observe the effect the breakpoint function has on the OpenGL state machine and the application behavior.

The monitored functions list contains OpenGL, WGL and OpenGL extensions functions supported by gDEBugger.
The Breakpoints list lists the currently selected breakpoints.
To add a breakpoint, select a function / functions from the Monitored Functions list and add it to the Breakpoints list by double clicking on it or by pressing the Add button.
To remove a breakpoint, select the function from the Breakpoints list and remove it by double clicking on it or by pressing the Remove button.
Press the Remove All button to remove all of the breakpoints.
When this check box is selected, gDEBugger will break whenever an OpenGL Error occurs in the debugged application.
When this check box is selected, gDEBugger will break the application run when detected error occurs. For example: A detected error will be triggered when the application asks for an extension function pointer from one render context and then uses it in another render context.
gDEBugger will break on all active breakpoints when "Enable Breakpoints" is chosen.
You can find a function easily in the Monitored Function list by putting the curser on the list and typing the first few letters of the function name. The list will scroll automatically to the first function beginning with these letters.